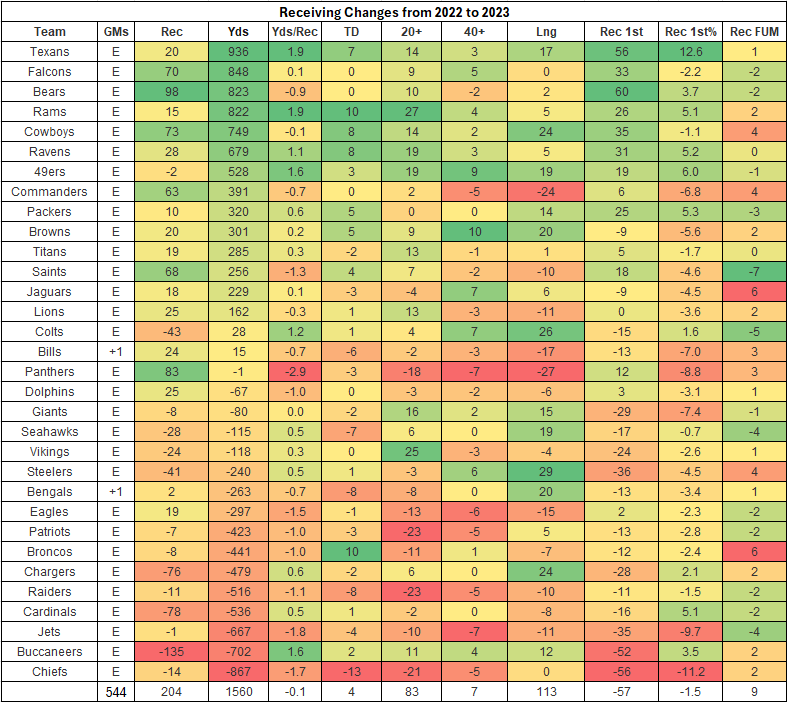
2024 NFL: Receiving Changes from 2022 to 2023
2024 NFL: Receiving Changes from 2022 to 2023 (Google Sheet)
Much of the receiving stats overlap with passing changes because they are not separated into RB, WR, and TE categories. Receivers caught 204 more passes for 1,560 yards and four touchdowns more than in 2022. Here’s the receiving data broken down by each position:
The switch to Sean Payton did indeed lead to a jump in running back production for their running backs. They lead the NFL in catches (131), receiving yards (851), catch share (38.9), receiving yards % (24)), and targets (153). Unfortunately for the fantasy market, this opportunity was divided between three backs. As a result, their tight ends finished last in catches (39) and receiving yards (362).
The Jets featured their running back in the passing game (116/801/4 on 149 targets), giving Breece Hall an excellent opportunity in 2024. The upgrade to Aaron Rodgers should create many more scoring chances this year.
San Francisco’s running backs led the league in receiving touchdowns (9). In addition, their wide receivers (15.7) and tight ends (15.4) gained the most yards per catch in the NFL.
The Rams ranked last in running back receiving stats (48 catches for 344 yards and three touchdowns on 69 targets). Their wideouts caught a league-high 69.5% of LA’s completions and had the most targets (397) while gaining the second-most receiving yards % (76).
Five teams' wide receivers caught 250 passes or more: Dallas (263), Cincinnati (257), Miami (257), Los Angeles Rams (251), and Los Angeles Chargers (250). The Falcons’ wideouts (124/1,650/4) had the league's lowest output and opportunity (208 targets), followed by the Jets (152/1,696/6).
The biggest surprise when reviewing the wide receiver stats last year was that the Packers (27) tied with the Cowboys (27) for the league lead in touchdowns from their wideouts.
Miami led the NFL in wide receiver yards (3,620), gaining 77% of the Dophins’ overall receiving yards. Carolina’s wideouts gained a league-low 10.3 yards per catch.
First offenses featured their tight ends in the passing game:
Minnesota Vikings - 134/1,367/8 on 179 targets
Kansas City Chiefs - 126/1,315/8 on 171 targets
Jacksonville Jaguars - 132/1,153/5 on 167 targets
Atlanta Falcons - 114/1,380/7 on 172 targets
Arizona Cardinals - 118/1,106/4 on 160 targets
Baltimore led the league in tight end touchdowns (12), just ahead of Detroit (11) and New Orleans (10). A Dolphin tight end didn’t score last year while battling Denver (39/362/4 on 62 targets) for the worst tight end production (41/414/0 on 52 targets). Cincinnati finished last in yards per catch (7.8) for tight ends.
Here are the averages for all 32 teams for receiving production for running backs, wide receivers, and tight ends:
RB - 79/564/3 on 102 targets ~ 21.5% of each team’s completions. Backs gained 14% of the league’s receiving yards while averaging 7.2 yards per catch.
WR - 205/2,585/15 on 325 targets ~ 55.8% of each team’s completions. They accounted for 65% of the league’s receiving yards on 12.6 yards per catch.
TE - 83/849/5 on 117 targets ~ 22.7% of each team’s completions. Tight ends gained 21% of the league’s receiving yards on 10.2 yards per catch.


