


2024 Final National Fantasy Baseball Championship FPGscores

2024 Final MLB Stats Sorted by FPGscores (Updated with 2024 Final NFBC Category Targets)
The FGPscores in the above link are used with 2024 final player stats (The NFBC hasn’t updated the 2025 position eligibility). I have adjusted the final category targets from last year to show what each player would be worth for the 2025 draft season.
The category stats in 5 X 5 Roto Formats change slightly each year. By updating after each season, I have the information to rate the player for the upcoming draft season. I will apply these new data points once I finish the 2025 projections.
Note: The above link is restricted. For anyone looking to view the Google Sheet, you only have to make a request. All subscribers have free access, but I don’t know who is interested in baseball content, so I didn’t want to mass-load everyone’s email address to the spreadsheet to view.
FPGscore
The development of FPGscore started with the theory around Average Player Scores. When drafting, it is challenging to determine a baseball player’s value when having multiple positions in the fantasy baseball market, never mind numerous scoring categories. The average player theory is a way to compare a player’s value for overall impact in team-building in 5 X 5 roto formats and within the spectrum of each position or category.
Once I have a baseline of the average player, I can determine which players have the most significant edge. After establishing these scores at each position, the next step is to compare the best options at other positions.
Each season, the player pool changes in the fantasy baseball world. Some positions will have more depth, and others will only have a few reliable options. Therefore, I want to find each position's hidden values when preparing to draft. Doing this allows drafters to select the most potent options at the other positions early in the draft.
I developed a way to determine each player’s value within each category relevant to their production. For example, hitters have five offensive categories (batting average, runs, home runs, RBIs, and stolen bases). Pitchers also have five categories (wins, ERA, WHIP, strikeouts, and saves).
With these scores, a fantasy drafter can quickly look at stats to see which players have the most value, either by last year’s stats or this year’s projections from any source. When using projections, a fantasy manager’s success will only be as strong as their ability to interpret information. Therefore, finding the best source for that viewpoint is essential.
My FPGscore is built for 12-team, 5-by-5 Roto leagues with once-a-week pitching moves. I could modify these options for 10-team and 15-team leagues in the future and add bi-weekly pitching move formats.
The most challenging part for any fantasy gamer to understand is draft rankings or cheat sheets due to the underlying information behind each player's profile. At any position in baseball, I may only like a handful of players. When I rank them, I can't leave players I don't like off the cheat sheet, and it wouldn't be fair to list them poorly based on my opinion.
Here’s a look at the midpoint values in 2024 in a field of 2,736 teams in all 10 categories:
BA: .2518, R: 1,031, HR: 283, RBI: 992, SB: 173, W: 86, SV: 63, ERA: 3.743, WHIP: 1.193, K: 1,333
Average Draft Position
The fantasy market uses ADPs (average draft position) to prepare for the upcoming draft season. ADPs give drafters a feel for a player's value in the open market. It is a great tool, but a fantasy player must understand the value of the information.
ADPs from mock drafts have less merit as these leagues won’t be played out, and many drafters lose interest at some point during the draft. The best information in fantasy baseball comes from drafters playing for real money.
Value of FPGscores
FPGscore can work with any projections to deliver results. First, I research all 30 baseball teams. I then do the profiles for each major league team's projections. With this information, I provide rankings based on the FPGscores. Also, I can back-check the results from the previous season to see how each player stacked up against their competition. The goal is to compare players with different skill sets and find the most valuable options for a fantasy team.
At the same time, I can deliver weekly rankings based on playing time and opportunity. I break the season into 27 weeks (two half weeks – Week 1 and the All-Star break) to develop the weekly results. If a player is projected to play in seven games, he’ll have a better chance to produce stats in the counting categories. More playing time doesn’t necessarily mean he’ll have a higher score than a player with a much higher skill set with five games.
Note: FPGscore equations are adjusted each season for the current playing field in major league baseball. If home runs decline, a big power hitter will be rewarded for his edge in home runs. Likewise, if steals are scarce, an elite base stealer will have a higher impact in the stolen base category.
Wins Category
The midpoint for wins in 2024 was 86, divided into nine pitching slots, which comes to 9.556 wins per pitcher. I then used the overall standing from a league with 2,736 teams to determine the points gained for a win or lack of a win. First, I used +/- 900 spots in the overall standing to get a range of points gained or lost from the midpoint of wins. It was amazing to see 1,882 teams fall between 75 and 95 wins. Next, I divided 1,800 overall points by 20 wins to find that each win was worth 90.00 overall points. There were 2228 leagues in this competition, so each win within a single league environment was worth .394737 league points.
ERA and WHIP Categories
The midpoint in innings for the ERA and WHIP categories came at 1323.1 in 2024, almost matching the previous season (1,324.0). ERA (3.743) and WHIP (1.231) improved last year. For each pitcher, I subtracted their innings from 1,323.1. I then multiplied the midpoint in innings pitched by .41589 (3.743/9). This data gave me the total number of runs allowed for the remaining innings for the midpoint in ERA by inning. I then added the total number of runs allowed by each starting pitcher and divided that number by 1,323.1 innings. This result delivered each pitcher's +/- impact based on the number of innings pitched or projected to pitch. Next, the range of 1,800 league points was divided by a gap of .537 in ERA (4.006 – 3.469). This result (3351.9553) was then divided by 228 leagues. Finally, I used a minus 14.7016 data point to show that a lower ERA awarded more points.
I repeat this same process for WHIP. The range of overall points (1,800 spots) was divided by .105 (the gap in WHIP from 1.140 to 1.245). I then divided it by 228 leagues to deliver -75.188. Again, I used a negative number as a lower WHIP is the desired result.
Strikeouts
For strikeouts, the midpoint total was 1,333 strikeouts. Pitchers aren’t equal in Roto formats, but I must divide 1,333 by nine pitching spots. The average sum of strikeouts per pitcher came to 148.111. The range of strikeouts for 1,800 teams came to 213 (1,209 to 1,422). Each strikeout was worth 0.037064 points in the standing after dividing by 228 leagues.
Saves
This midpoint for saves was 63 in this event. A fantasy manager typically will get saves from two to three roster spots in their starting lineup, but he must base the target goal on nine pitchers, leading to a negative score for each starting pitcher in saves. Over 1,800 spots in the overall standings in a 2,736-team event, there was a difference of 37 saves. This total came to 0.213371 points in a single league per save. Many fantasy managers play the save category differently, creating a wide range of results. A format with an overall prize does lead to more teams competing in this category.
Batting Average
I used the same theory for ERA and WHIP for batting average. Looking at the starts for all 2,736 teams, I determined I needed 7,483 at-bats and a batting average of .2518 to be at the midpoint in 2024. For each batter, I subtracted their at-bats from 7,483, then multiplied the result by .2518 to give the total number of hits to deliver a midpoint batting average. I then added the player's total hits to this number and divided that total by 7,483 at-bats. These results gave me the impact of each player as far as +/- in batting average. The range of 1,800 spots in the standing was 0.0131 points in batting average or about 98.03 hits over 7,483 at-bats. So, 1,800 divided by .0131 divided by 228 leagues = 602.652 points for batting average.
Runs
The midpoint for runs was 1,031. The range was 138 runs over 1,800 spots in the standings, which delivered 0.05721 points per run in a single league.
Home Runs
The midpoint for home runs was 283. The gap between 468th and 2,268th place in a 2,736-team format was 59 home runs or 0.13381 points per home run in a single league.
Runs Batted In
The midpoint for RBIs in 2024 was 992. The difference in 1,800 points in the overall standing in RBI was 150 RBIs. This number worked out to .052632 points per RBI in a single league.
Stolen Bases
A team needs to get 173 stolen bases to finish at the medium point last season. The gap between 1,800 spots in the overall standing was 67 stolen bases, leading to each steal being worth 0.117832 points in roto formats.
Using these totals, a fantasy manager can easily see which players had the most value last season. It is a tool that also helps you make future decisions. The real trick is to create these values for this year’s projections. A drafter can make better draft decisions by understanding the player pool and each player’s value within each category. Here’s a chart for batters and pitchers to show power points gained or lost in each category within a league environment in 2024. Here’s a table to help understand the gains and losses in FPGscores in each category:
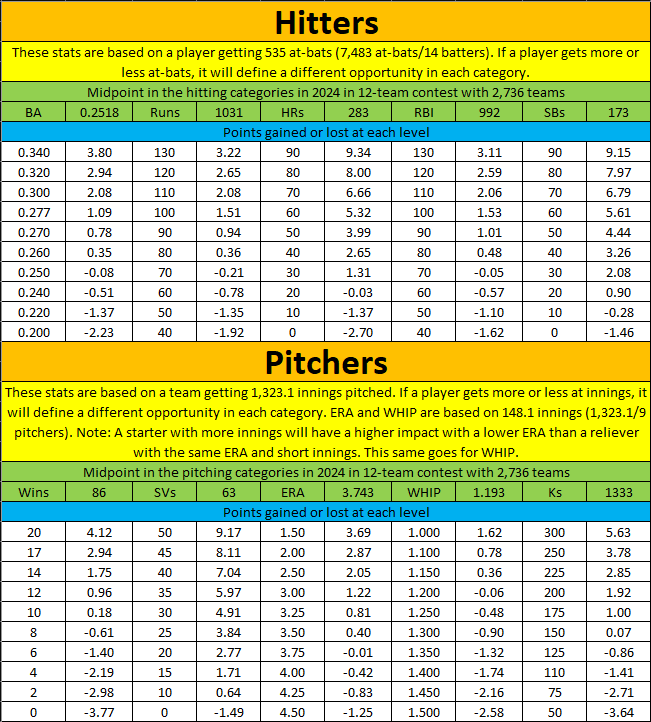
To add some food for thought about values in each category, a player would need to hit these stats to gain three points in each category in a league environment >>> .322 BA, 127 runs, 43 home runs, 128 RBIs, and 38 stolen bases on the hitting side. Likewise, pitchers would need about 18 wins, 21 saves, 1.90 ERA, 0.845 WHIP, and 229 strikeouts to gain about three points in each category. Note: All pitcher gains or losses in ERA and WHIP are based on 148.1 innings pitched.
Draft Decisions Trade-offs
Once I have each player's projections calculated for FPGscores, I can compare all players' values. For this information to succeed, I must compare players at like positions to help identify potential edges and sleepers.
ADPs and a player's draft value help fantasy managers make trade-off decisions within drafts. Once drafters have this information, they must decide how much they trust or agree with a player’s projections. The next step is comparing that player with other players at the same position in the projected ADPs.
The bottom line is that a fantasy manager is trying to gain an edge with each of his first few picks in the draft while filling as many categories as possible. Each decision takes a fantasy team in a different direction.
I also have access to multiple other events with large amounts of teams competing for an overall championship. The information I used is from a league with once-a-week transactions for pitching.
The next step when making decisions for 2025 comes from reviewing projections with FPGscores. The second level of information helps put a player in perspective based on his career path and current opportunity. The first set of forecasts won’t be released until each major team has been researched from early January until the middle of February.